Hamzah Zahid

Data Analyst: SQL · Excel · Power BI

I turn messy public datasets into decisions. Two end-to-end analytics projects below, each built from real source data through cleaning, a validated SQL model, and analysis that changes what you'd actually do.

SQL Excel Power BI Data cleaning Data validation KPI definition Dashboard design Python (pandas)

Flagship projects

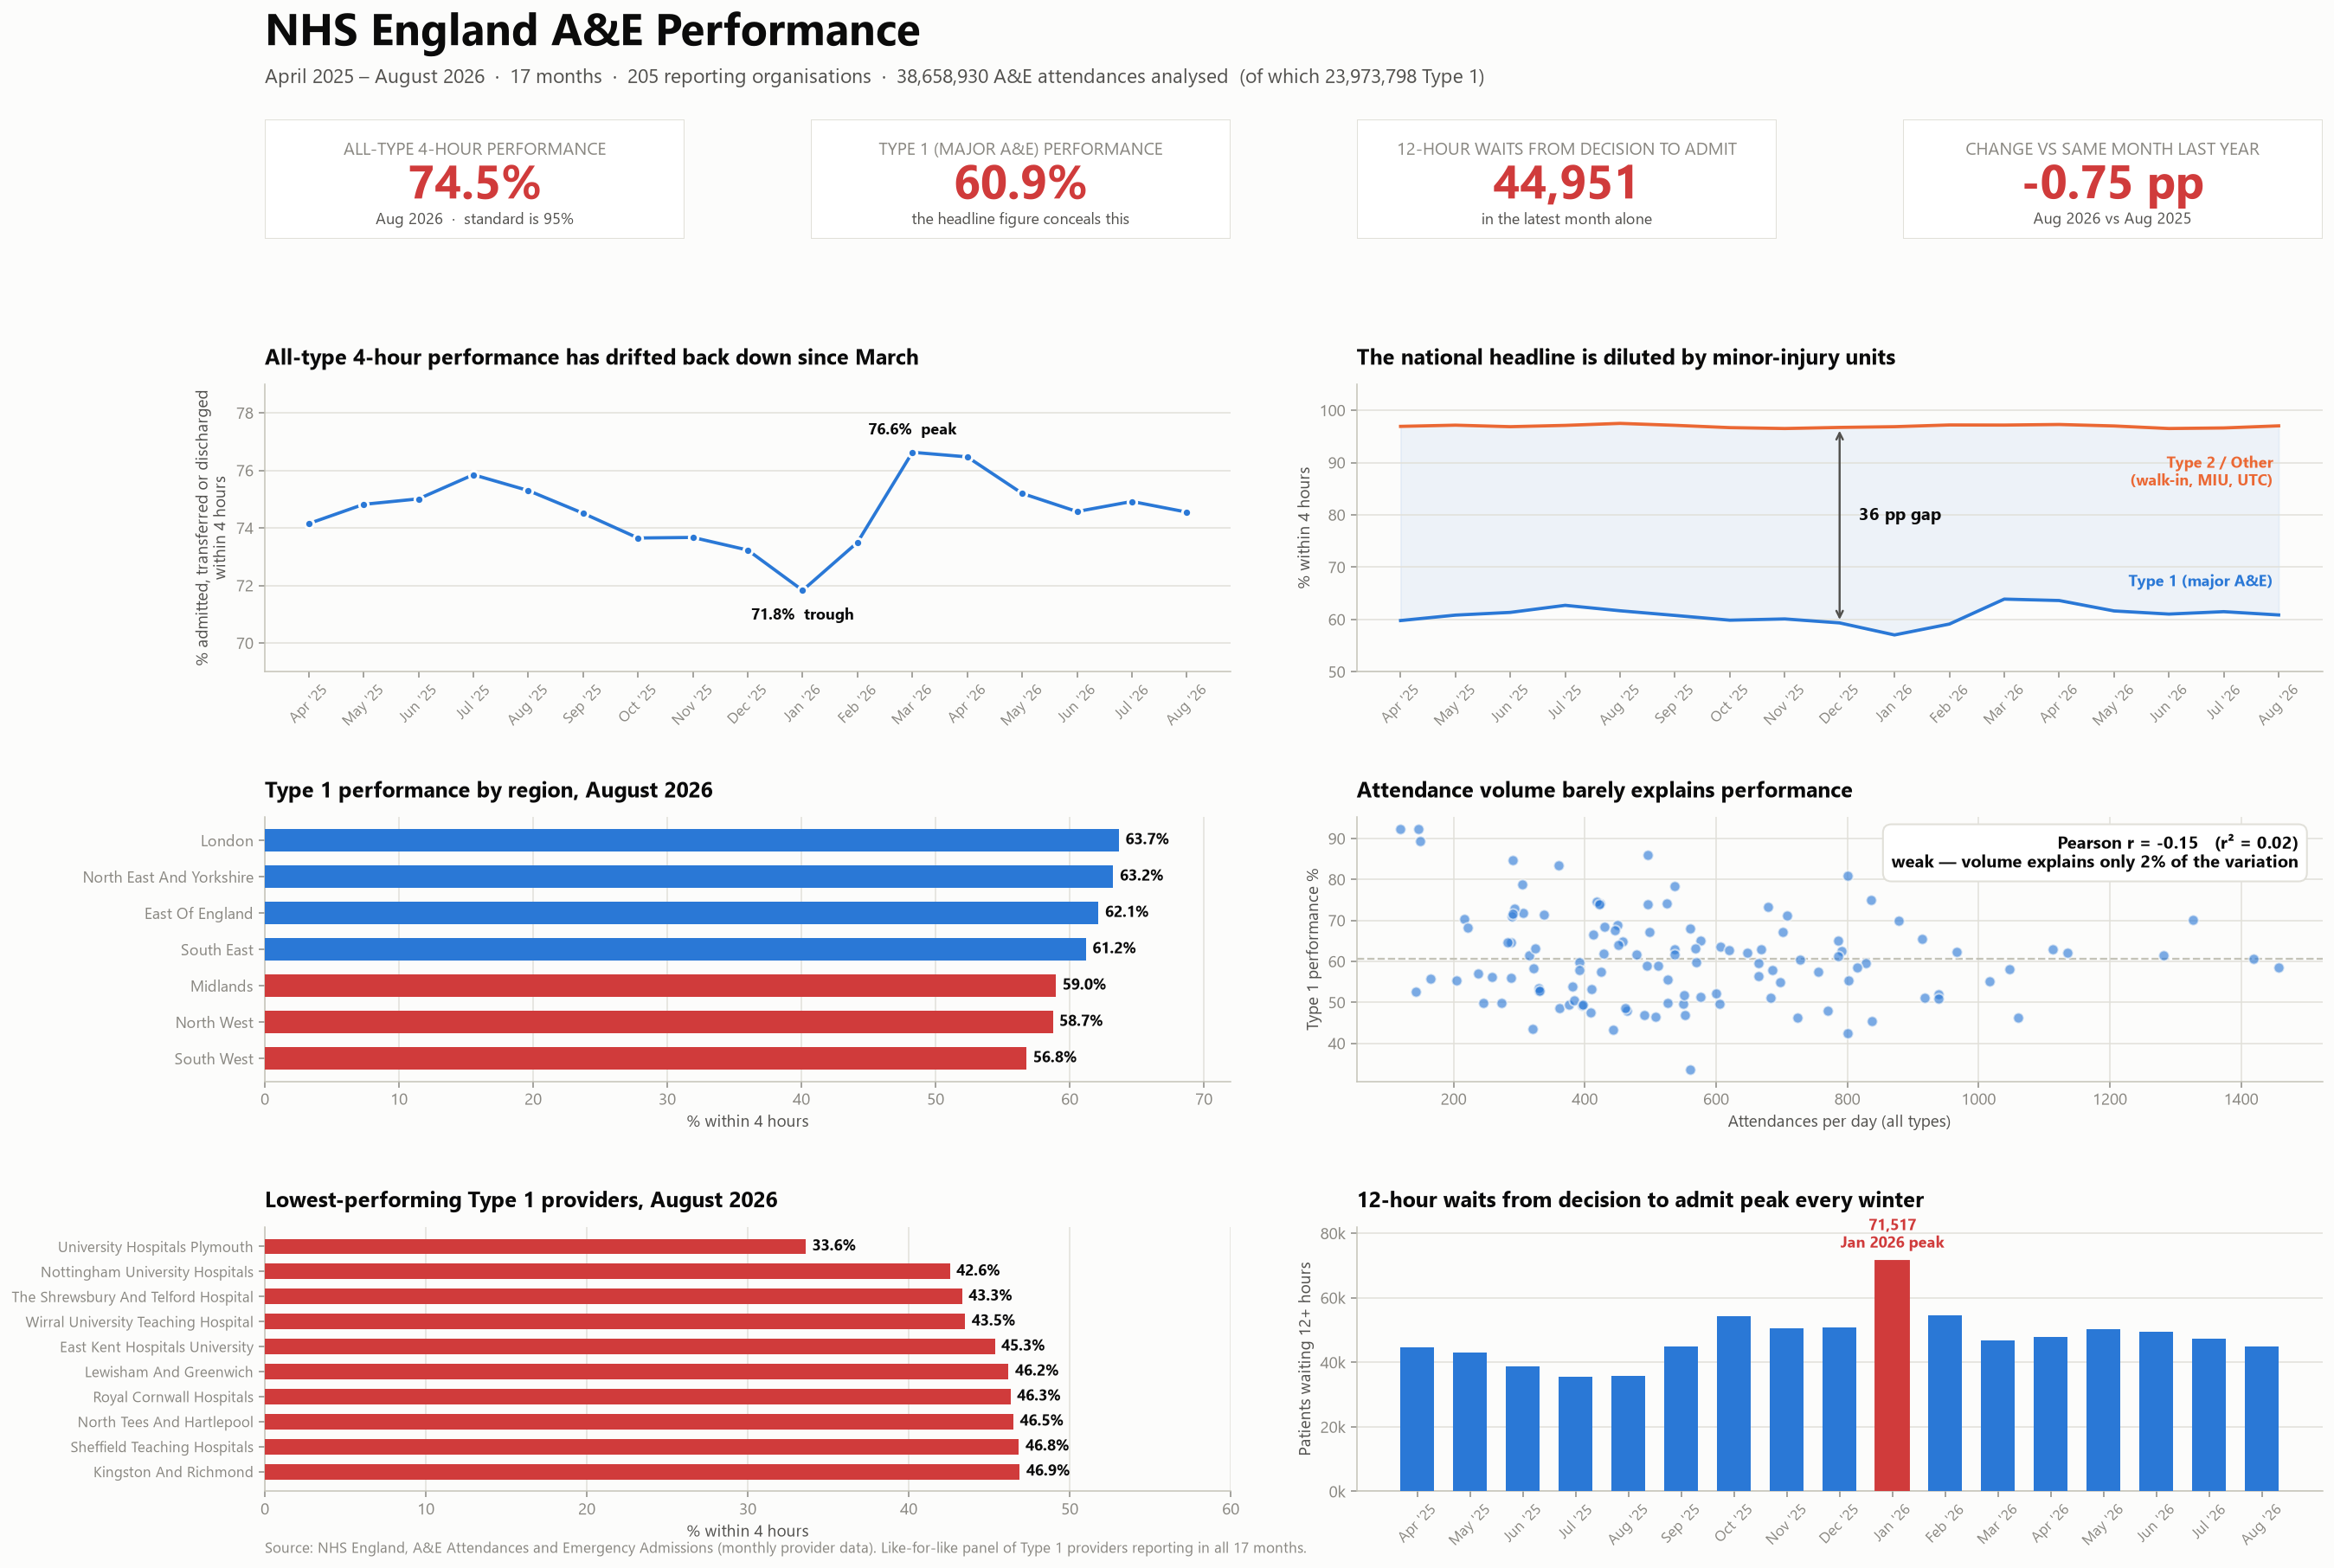
Dashboard of NHS England A&E performance showing national trend, regional variation and provider rankings

NHS England A&E Performance Analytics

17 months of official NHS data, and why the 74.6% national headline hides major A&E departments running at 60.9%.

38.7M
Attendances analysed
205
Organisations
12
SQL queries
17
Validation checks
17
DAX measures
  • Found a defect that doubled every national figure. Each monthly file embeds a grand-total row with inconsistent casing. Caught it because a region called "Total" held exactly half the national attendances.
  • Winter is worse but quieter. Performance drops 2.1 points and trolley waits rise 35% per admission, on fewer attendances per day. That points at admission flow, not front-door demand.
  • Volume doesn't explain performance (r = −0.15, r² = 0.02 across 120 providers).
  • 118 of 120 major providers missed the 95% standard in every single month.
SQL / SQLiteExcel Power BI Python
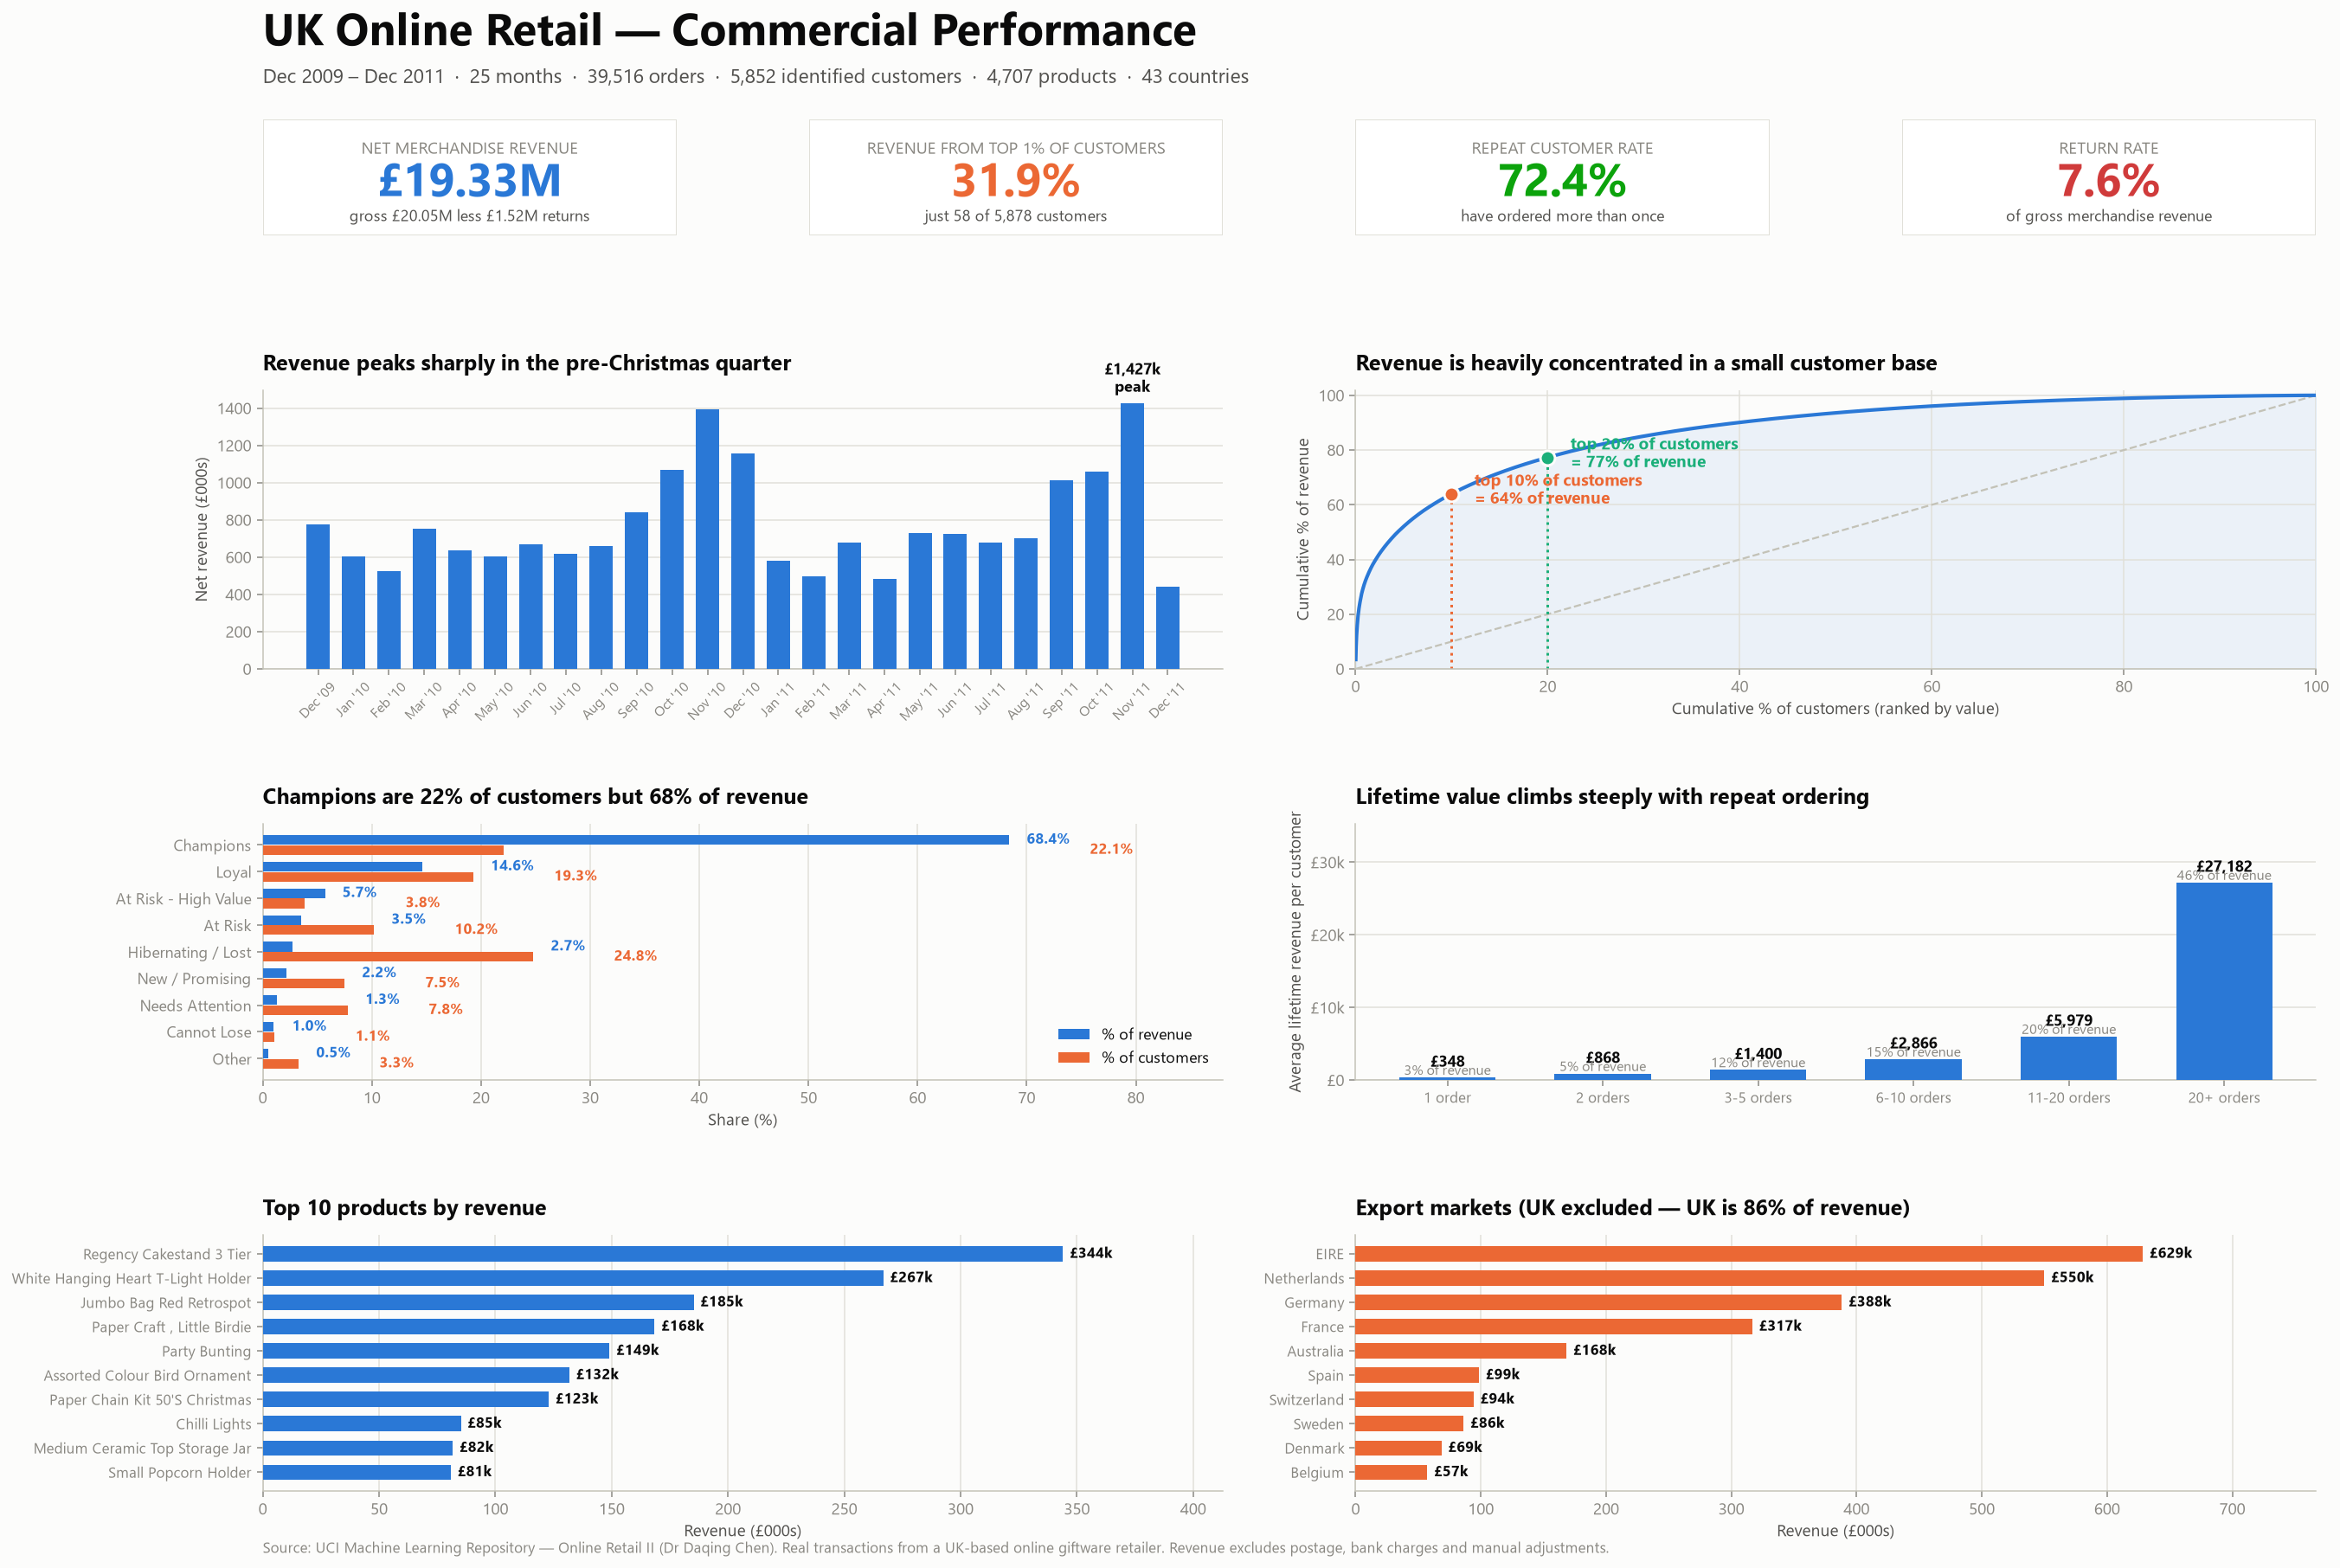
Dashboard of UK online retail commercial performance showing revenue trend, customer concentration and RFM segments

UK Online Retail: Commercial Analytics

1.07 million real transactions, £20.05M revenue, and the 226 customers quietly taking £1.01M out of the business.

1.07M
Transactions
£20.05M
Revenue analysed
5,878
Customers segmented
12
SQL queries
17
Validation checks
  • 58 customers generate 31.9% of revenue. The top 10% generate 64%; the bottom half contribute 6.4%.
  • £1.01M is actively decaying. RFM segmentation surfaced 226 "At Risk - High Value" customers averaging £4,487 each and 341 days since ordering.
  • Guest orders are nearly double the size of identified ones (£915 vs £475), so 13.3% of revenue can't be attributed to anyone.
  • A validation check caught a real anomaly: a cancellation carrying a positive adjustment. Scoped the rule rather than editing the data.
SQL / SQLiteRFM segmentation ExcelPython / pandas

How these were built

Both projects use real public data, downloaded programmatically with source URLs and SHA-256 hashes recorded. Each runs as a reproducible pipeline: profile the raw data, apply documented cleaning rules that answer measured defects, build a validated star schema, then analyse. Every figure quoted is machine-derived from the query outputs and validation results in each repo; nothing is typed by hand or estimated. Both builds fail loudly if any validation check returns a non-zero defect count.